Is your money doing a good job for you?
How do you tell?
What do you use to measure the progress you are making in your financial life?
The three-part framework that I use to support you in making the most of your finances, provides some good perspective: ORDER, PURPOSE, PROGRESS.
Investment Strategy Management (PROGRESS):
If you want to measure how well your fund manager is doing the job you employed her to do, you look at a benchmark.
For example, if you asked her to manage a portfolio of global shares, you can go check the factsheet of the MSCI World Index ETF. This is an Exchange Traded Fund (ETF) that tracks the worlds developed stock markets.
It will give you an idea of how she is doing on a comparative basis.
So far so good. But there are a couple of issues that you note will soon crop up.
1. Most portfolios are multi-asset in nature.
This means they invest in equities, bonds, cash, property and probably some kind of alternative (gold, crypto, Private Equity). Then you have offshore versus local assets, which introduces currency risk.
It becomes less easy to pick a benchmark that captures performance that is comparatively measurable.
One solution is to look at a ‘peer-group’. This is made up of a bunch of funds which have a broadly similar investment opportunity set.
The peer-group will let you know how the fund you own performed relative to other options you could have chosen at the same time.
Kind of like an opportunity cost consideration.
2. Cashflows change things.
A factsheet showing the fund performance conveniently ignores cashflows.
In reality you probably invest money on an ongoing basis, rather than as a single lumpsum.
The impact on performance is significant.
Example: You invest $1 a month for a year. Only 1$ out of the $12 is invested for 12 months. The last $1 was actually only invested for 1 month. If markets were going up over the year, your own performance is going to be lower than the fund factsheet. (Each month you paid more for your investment than at the start of the year). If markets were going down, you bought each month at a lower price and your performance should look better.
Your investment statement, from your platform or admin provider, should reflect your performance including the impact of when you invest or take out money from your account. We call these your cashflows.
In this context, it makes sense to look at your statement and measure it relative to what your planning process revealed as a required return target.
Financial Planning Perspective (PURPOSE):
Any goal you have will have a future target value, a time horizon and an amount you can contribute towards it.
From this you can calculate a required RETURN TARGET that will get you to your goal.
In theory, you would then build a portfolio of investments to target that return requirement with as little chance of failure as possible.
Something like, I need 12% after fees to turn my current R100 into the R1000 I need in 20 years time. How am I doing?
This works to make it more meaningful to your actual purpose.
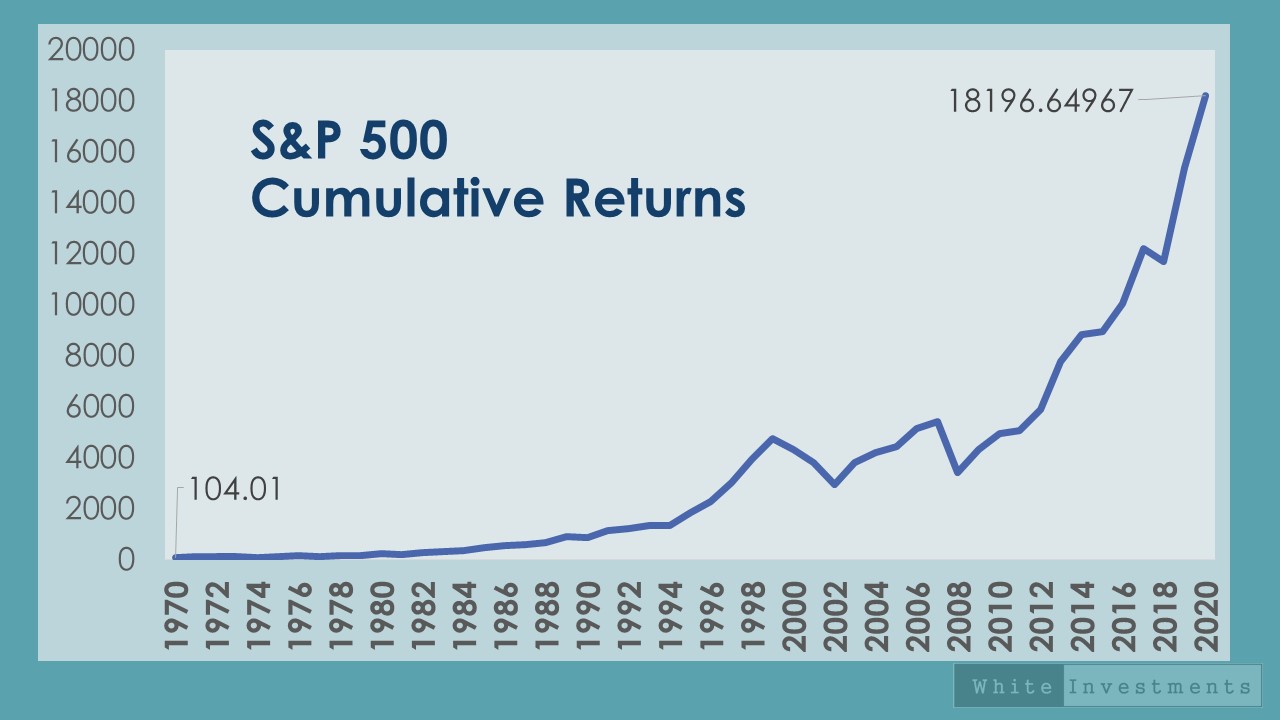
But markets tend not to work in straight lines.
A 12% return after fees may actually include periods of gains much bigger than 12% with the occasional negative year thrown in.
It can be difficult to know where you are at any single point in time.
As we all know market returns are not in our control.
It could therefore be helpful to measure something that is more in our control. Like our contributions.
The contributions you are able to make are impacted most by our personal finances.
Personal Finance Perspective (ORDER):
How you manage your personal finances determines your ability to meet your required contribution rate (assumed in the planning process).
At least this involves managing stuff that is more in your control.
How you use debt. What your living expenses are. How much you have available as disposable income.
If you are not putting away the money you thought you could, it is highly unlikely your overall plan, based on those contributions, is on track.
If the planning assumptions are not right then there is a good chance your investment strategy is not appropriate either.
What is the point
The point is your success is dependent on getting all three areas right.
ORDER=>PURPOSE=>PROGRESS=>
Measuring your progress in a way that captures all of these elements makes sense. It is a good idea to look at different metrics that are appropriate for each.
We may like to think managing money is a science but there is a lot more art to it than meets the eye.