
How investment returns work for you
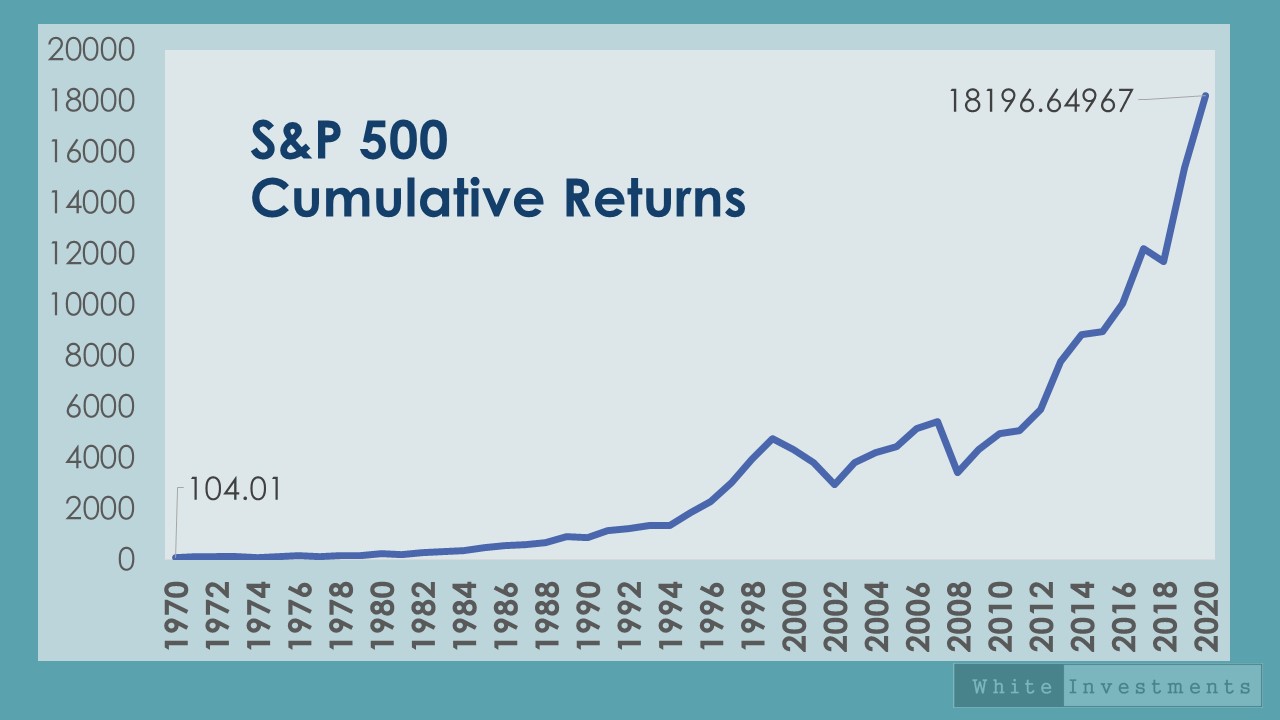
It is important to understand how investment returns work in order to apply them in a meaningful way in your financial life.
Most of the time when we hear somebody talking about long-term returns, they mean cumulative returns.
You have a starting point which you adjust each year by the total return (price + income) for a number of decades.
Just about every equity index over a 50 year time horizon is going to look pretty impressive on this basis.
Exhibit A: S&P 500 total cumulative returns in the graphic ABOVE. Turning $100 invested into $18,000 over the 50 year period.
Who does not want a piece of that?
Cumulative returns are the main reason people repeat very sagely, ‘It is not about timing the market but time in the market’.
But in the real world many of the goals and objectives we are planning towards do not have the luxury of a 50 year time horizon.
Shorter-term objectives should be seen in context
Maybe you are five years away from retirement. Or your child’s education costs you have been saving for from birth, are kicking in a couple of years from now.
When you stop working you will typically begin consuming your wealth and this too is made up of multiple shorter time periods. You will need to cover cost outflows each year into perpetuity.
In this context it would perhaps be more helpful to to consider the returns we are likely to receive over shorter time periods – Let’s say 5 years. If we look at returns over the last five years but on a continuous basis – we call this rolling 5 year returns. (The dark blue line in the graphic ABOVE). Each data point shows you what your annual returns would have been if you had invested 5 years before hand.

As you will note from the graph, it becomes less obvious that just buying an equity index will actually do the best job for you. There are quite clearly a few five-year-periods where nothing much happens. Then there are those where very large returns are enjoyed and inevitably periods where for five years running you lose money.
Why this matters to your financial plan
In planning we often use the average of the cumulative experience (the red line in the graphic) to provide a ‘decent’ indication of expected returns. But this approach knowingly fails to capture the current valuations (expensive or cheap by price-to-earnings for example) and therefore the future expected returns.
And as the graphic below shows, even in a developed market like the US you can go for extended periods without earning any returns at all from shares. This is the S&P 500 index from 1998 (pre-dot.com to well after the Global Financial Crisis (2013)).

How you can improve your odds of success
– You will probably receive returns way above and below the average. You can receive negative returns over a 5 and 10 year period.
– The biggest determinant of future returns is the price you pay for an asset.
– Periods of above average returns are, more often than not, followed by periods of below average returns.
– Extrapolating the most recent excellent 5 year performance of an asset class is almost always wrong for the next 5 year period.
– Paying attention to your cashflows and the timing of those cashflows is very important to your ultimate success.
– Timing the market may be a fool’s errand, but buying regardless of valuations is similarly futile.
– Not aiming to pick the best performing asset class year in and year out is a sensible strategy.
– Seeking better consistent long-term average returns will work better when targeting specific objectives.
– Returns should always be evaluated in context of the risk you must take to achieve them.
0 comments